Graphing Student Progress: Making Data Visual and Accessible
Tracking growth in reading fluency is essential for effective instruction, but numbers alone don’t always tell the full story. When progress-monitoring data is made visual, both teachers and students can better understand growth and set meaningful goals. Graphing student progress transforms assessment into a powerful motivational and instructional tool.
Why Visual Data Matters
For teachers, data is only useful if it can be interpreted quickly and applied effectively. Graphs help reveal patterns that may not be obvious in raw scores, such as plateaus in growth or sudden improvements following an intervention. For students, seeing their own progress in a visual format increases engagement and ownership. Research shows that self-monitoring and goal-setting improve both motivation and performance 1.
Graphing Fluency: Key Metrics
When monitoring oral reading fluency (ORF), educators often track:
- Words Correct Per Minute (WCPM): A clear indicator of rate and accuracy.
- Error Rates: To ensure fluency growth is not coming at the expense of accuracy.
- Prosody Indicators: Qualitative notes on phrasing, expression, and pacing.
By graphing these metrics over time, educators can compare student growth against established benchmarks while also highlighting individual improvement 2.
Making Data Accessible to Students
Longitudinal research on fluency development emphasizes the importance of student engagement in monitoring progress 3. When students plot their own WCPM scores or comprehension checks on a simple line graph, they gain a concrete understanding of improvement. This practice builds confidence and creates opportunities for meaningful conversations about effort, practice, and goals.
How Flow Reading Fluency Supports Visual Data
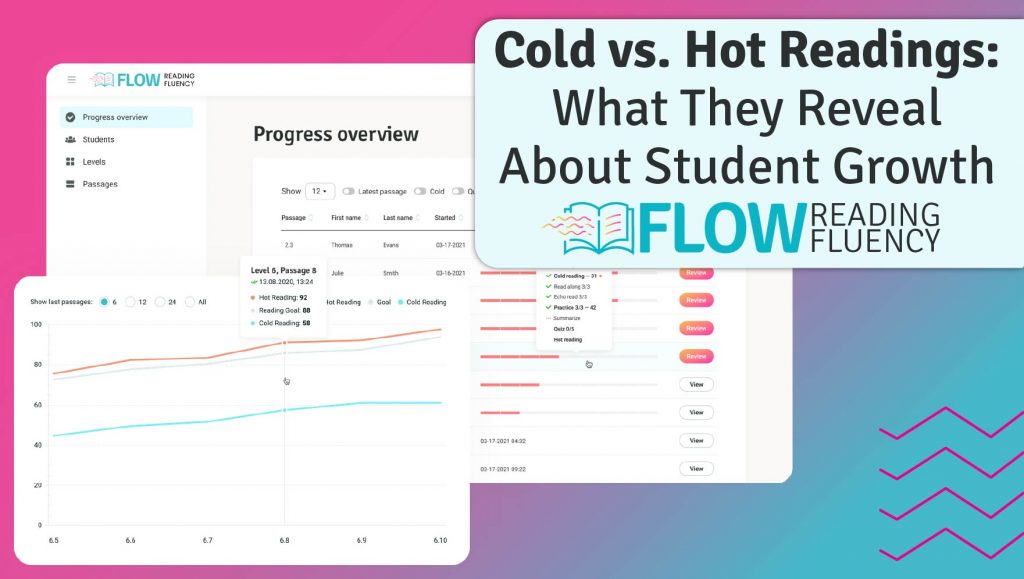
The Flow Reading Fluency program automatically generates graphs and charts after each cold and hot reading. This means that both teachers and students can instantly see growth in accuracy, rate, and expression. By making the invisible process of fluency development visible, Flow transforms assessment into motivation.
Final Thoughts
Graphing student progress is not just about accountability—it’s about empowerment. When teachers and students can see growth over time, data becomes more than numbers on a page; it becomes a story of progress, effort, and achievement. Visualizing fluency data makes instruction more responsive and gives students the encouragement they need to keep moving forward.
References
- Fuchs, L. S., & Fuchs, D. (2001). Curriculum-based measurement: A CBM sampler. Assessment for Effective Intervention, 26(2), 23–30. ↩︎
- Hasbrouck, J., & Tindal, G. (2017). An update to compiled ORF norms (Technical Report No. 1702). University of Oregon, Behavioral Research and Teaching. ↩︎
- Miller, J., & Schwanenflugel, P. J. (2008). A longitudinal study of the development of reading prosody as a dimension of oral reading fluency in early elementary school children. Reading Research Quarterly, 43(4), 336–354. ↩︎

